

Categories
Market UpdatesPublished November 12, 2026
Cambridge MA Real Estate Market: November 2026 Update

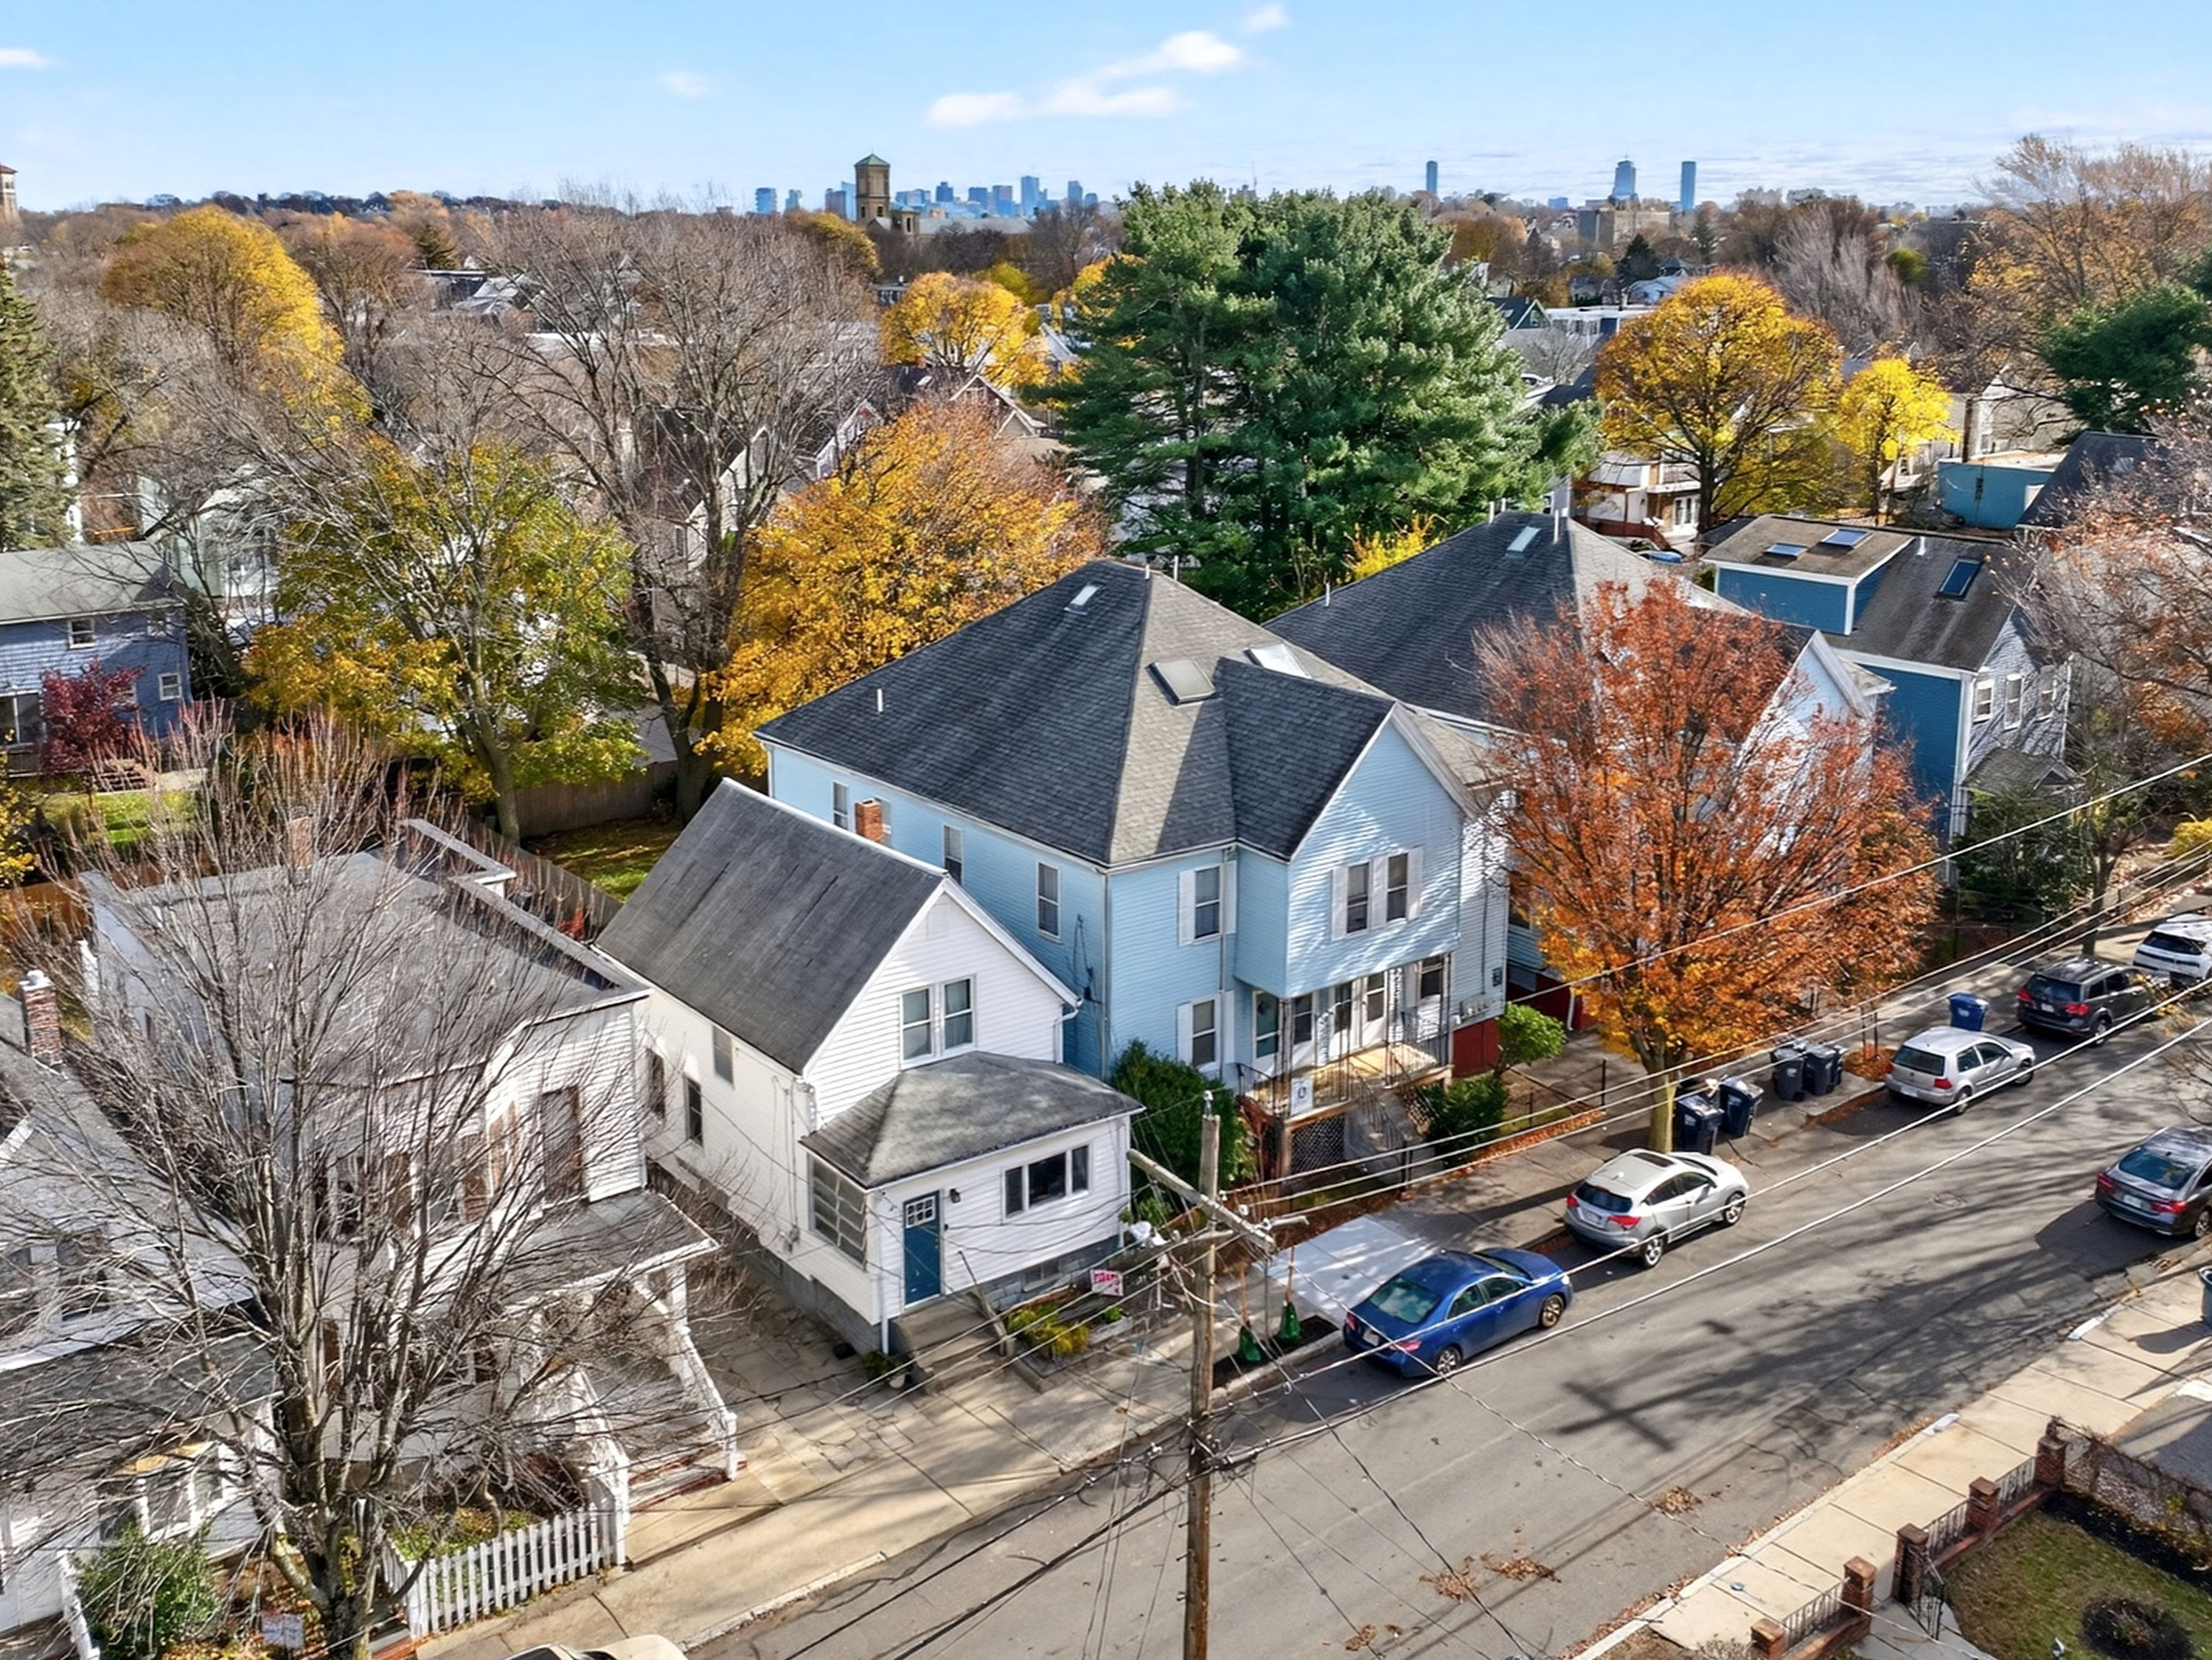
As Cambridge heads into the last stretch of 2026, the question we hear most is simple: did the year end up stronger or softer than last year? The honest answer is both, depending on what you own or want to buy.
The biggest story this fall is inventory. There are more homes for sale in Cambridge than there were a year ago, and that shapes almost everything else in the numbers below.
More homes have sold in Cambridge this year than in the same window of 2025, across single-family homes, condos, and multi-families, but sales have grown more slowly than the number of homes for sale. With more listings to choose from, buyers have more options and sellers have more competition. That helps explain why homes are taking a little longer to sell and why average sale prices are somewhat lower than last year. Buyers are still paying at or above asking on average. They are just being more deliberate about it.
Since 2014, the Santana Team has had more than 1,700 closings across Greater Boston, and Cambridge is a market we watch closely. Here is what the MLS PIN numbers show through the end of October.
What does the Cambridge real estate market look like right now?
Year-to-date closed sales through October 31, 2026. Percentages in parentheses show the change from the same January to October window of 2025. Source: MLS PIN. Active listings from MLS PIN On-Market Snapshots as of November 10, 2026, compared with November 7, 2025 (contingent listings excluded). Days on market for active listings are from a November 7, 2026 snapshot.
| Metric | Single Family | Condo | Multi-Family |
|---|---|---|---|
| Avg. Sale Price | $2,714,124 (-7.6%) | $1,186,566 (-2.1%) | $2,414,852 (-5.7%) |
| Median Sale Price | $2,460,000 (-2.8%) | $951,250 (-2.9%) | $2,150,000 (+6.2%) |
| Avg. Days on Market | 44 days (+7%) | 48 days (+9%) | 45 days (+25%) |
| Sale Price as % of List | 104% (-1 pt) | 101% (no change) | 101% (-1 pt) |
| Closed Sales YTD | 100 (+7.5%) | 458 (+12.5%) | 72 (+44.0%) |
| Active Listings (Nov 10, 2026) | 37 (+2.8%) | 166 (+16.1%) | 34 (+41.7%) |
| Avg. Days on Market, Active Listings (Nov 7) | 76 days | 74 days | 81 days |
A quick note on reading this: these are year-to-date figures through October, so they are not directly comparable to the year-to-date through March numbers in our April 2026 Cambridge update. The price rows compare the homes that sold in each year, not the change in value of the same homes, so a shift in which homes sold can move them as much as the market itself. That is why we show both the average and the median.
Why is inventory the biggest story in Cambridge this fall?
There are more homes for sale in Cambridge than there were a year ago. As of November 10, 2026, MLS PIN showed 237 active listings in Cambridge (+17%). Condos make up most of that inventory, with 166 on the market (+16%). Multi-families had the biggest jump, to 34 (+42%), while single-family inventory was nearly flat at 37 (+3%).
Sales have not kept pace. Cambridge closed sales through October rose 14.5% across all three property types. That is a real increase, but buyers now have more homes to choose from than the market is absorbing, and that is why timelines are longer and averages are lower.
Current listings are also sitting longer than the homes that sold. In early November, the single-family homes, condos, and multi-families on the market had been listed for an average of 76, 74, and 81 days. Homes that sold this year took 44 to 48 days on average.
For buyers, all of this means more choice, more time to compare, and more room to negotiate on homes that have been sitting. For sellers, it means more competition. Pricing to the real comparable sales and presenting the home well matter more than they did a year ago, especially for condos.
Inventory at a Glance: Active listings: 237 (+17%) · Avg. days on market, active listings: 74 to 81 days · Closed sales YTD: 630 (+14.5%)
How is the Cambridge single-family market holding up in 2026?
Single-family homes are still the most competitive part of the Cambridge housing market on price. On average they sold for 104% of list price this year, down 1 point from the same window of 2025. That is still a market where well-priced homes draw strong offers.
What changed is the average price. The average single-family sale through October was $2,714,124 (-7.6%), even though more homes sold (100, +7.5%). Averages at this price level move a lot with the mix of homes that trade. A few very large sales in one year, around Brattle Street or Avon Hill for example, can lift that year's average on their own. The median single-family sale price fell less, to $2,460,000 (-2.8%), which suggests the mix of homes is a big part of the change. For a seller, the takeaway is that your home's value depends far more on its own comparable sales than on a citywide average.
Homes are also taking slightly longer, at 44 average days on market (+7%). There are 37 single-family homes on the market as of November 10 (+3%), so single-family inventory is close to last year's level. Single-family listings in early November had been on the market for an average of 76 days.
Single-Family at a Glance: $2.71M avg price (-7.6%) · 104% of list (-1 pt) · 44 days on market (+7%) · Active listings: 37 (+3%)
Are Cambridge condos giving buyers more room to negotiate?
A little more than last year, yes. Condos are the busiest part of the Cambridge market, with 458 closed sales through October (+12.5%). The average sale price was $1,186,566 (-2.1%), and the median was $951,250 (-2.9%).
Condos sold at 101% of list on average, the same as last year, so most buyers are not getting big discounts. Timelines are a bit longer, at 48 days on market (+9%). The bigger story for buyers is choice: there are 166 condos on the market as of November 10 (+16%), and condo listings in early November had been on the market for an average of 74 days. Whether you are looking near Central, Harvard Square, or closer to Alewife, that is a meaningful set of options to compare, and it gives buyers time to look closely at condo fees, building condition, and association finances.
For sellers, that same inventory means presentation and pricing matter. Buyers can see a lot of alternatives side by side.
Condo Market at a Glance: $1.19M avg price (-2.1%) · 101% of list (no change) · 48 days on market (+9%) · Active listings: 166 (+16%)
What is happening with Cambridge multi-family homes?
Multi-family sales rose the most in percentage terms, though from a small base: 72 closed sales through October (+44.0%). The average sale price was $2,414,852 (-5.7%), but the median actually rose, to $2,150,000 (+6.2%). The lower average mostly reflects fewer very high-priced sales this year (the highest 2026 sale was $6,200,000).
These properties sold at 101% of list on average (-1 pt), and they are taking longer, at 45 days on market (+25%). For investors and owner-occupants, that points to a market where deals are getting done, but buyers are underwriting carefully and taking their time. There are 34 multi-families on the market as of November 10 (+42%), and multi-family listings in early November averaged 81 days on market. Asking prices in that group range widely, including one listing at $74,000,000, so the average asking price is not a useful guide. The listing count tells you more.
Multi-Family at a Glance: $2.41M avg price (-5.7%) · 101% of list (-1 pt) · 45 days on market (+25%) · Active listings: 34 (+42%)
How did October 2026 look in Cambridge?
October was a solid month for condos, with 50 closed sales at an average of $1,211,595, 100% of list, and 53 average days on market. Multi-families had 11 sales averaging $2,553,909 at 101% of list and 44 days on market.
Single-family homes had only 7 closed sales in October. They averaged $2,974,857 and 110% of list, with an average of 133 days on market. With so few sales, a handful of slower listings can move that average a lot, so we would not read October's single-family numbers as a new trend in either direction.
What does this mean for buyers and sellers in Cambridge?
Cambridge in late 2026 has more homes for sale than a year ago, and that drives most of what you see in the numbers. Sales are up modestly, prices are holding near asking, homes are taking longer to sell, and averages are somewhat lower than the same window of 2025.
For buyers, that means more inventory to choose from, especially in condos, a bit more time to make a decision, and more room to negotiate on listings that have been sitting. Strong homes still sell at or above list, so preparation still matters.
For sellers, pricing close to the real comparable sales for your home and property type is the main lever. Homes are taking 7% to 25% longer to sell than last year, depending on property type, and buyers have more options than they did a year ago.
Common questions about the Cambridge real estate market
Are Cambridge home prices going up in 2026?
Not on average. Through October, average sale prices were lower than the same period in 2025 for single-family homes (-7.6%), condos (-2.1%), and multi-families (-5.7%). These compare the homes that sold, not the value of the same homes. Medians fell less for single-family homes (-2.8%) and condos (-2.9%) and rose for multi-families (+6.2%). Homes are still selling at or above list on average, so this looks more like a measured market than a falling one.
Is Cambridge still a competitive market?
Yes, but it varies by property type. Single-family homes sold at 104% of list on average this year (-1 pt), while condos (no change) and multi-families (-1 pt) sold at 101%.
Are there more homes for sale in Cambridge right now?
Yes. As of November 10, 2026, there were 237 active listings in Cambridge (+17%): 166 condos (+16%), 37 single-family homes (+3%), and 34 multi-families (+42%).
Thinking about buying or selling in Cambridge?
Citywide numbers are a starting point. What matters is how they apply to your street, your building, and your timeline. Whether you are living in Cambridge and weighing a sale, or moving to Cambridge and starting a search, I am happy to walk through what this data means for your specific situation.
You can connect with the Santana Team.
Data is based on MLS PIN year-to-date closed sales from January 1 through October 31, 2026, compared with the same period in 2025, plus October 2026 closed sales and MLS PIN On-Market Snapshots as of November 10, 2026 (compared with November 7, 2025) and November 7, 2026. Percentage changes compare 2026 with the same period of 2025. Market conditions can change, and individual property outcomes may vary.

Santana Team
| Santana Team | Keller Williams Boston Northwest
or another way