

Categories
Market UpdatesPublished November 12, 2026
Medford MA Real Estate Market: November 2026 Update

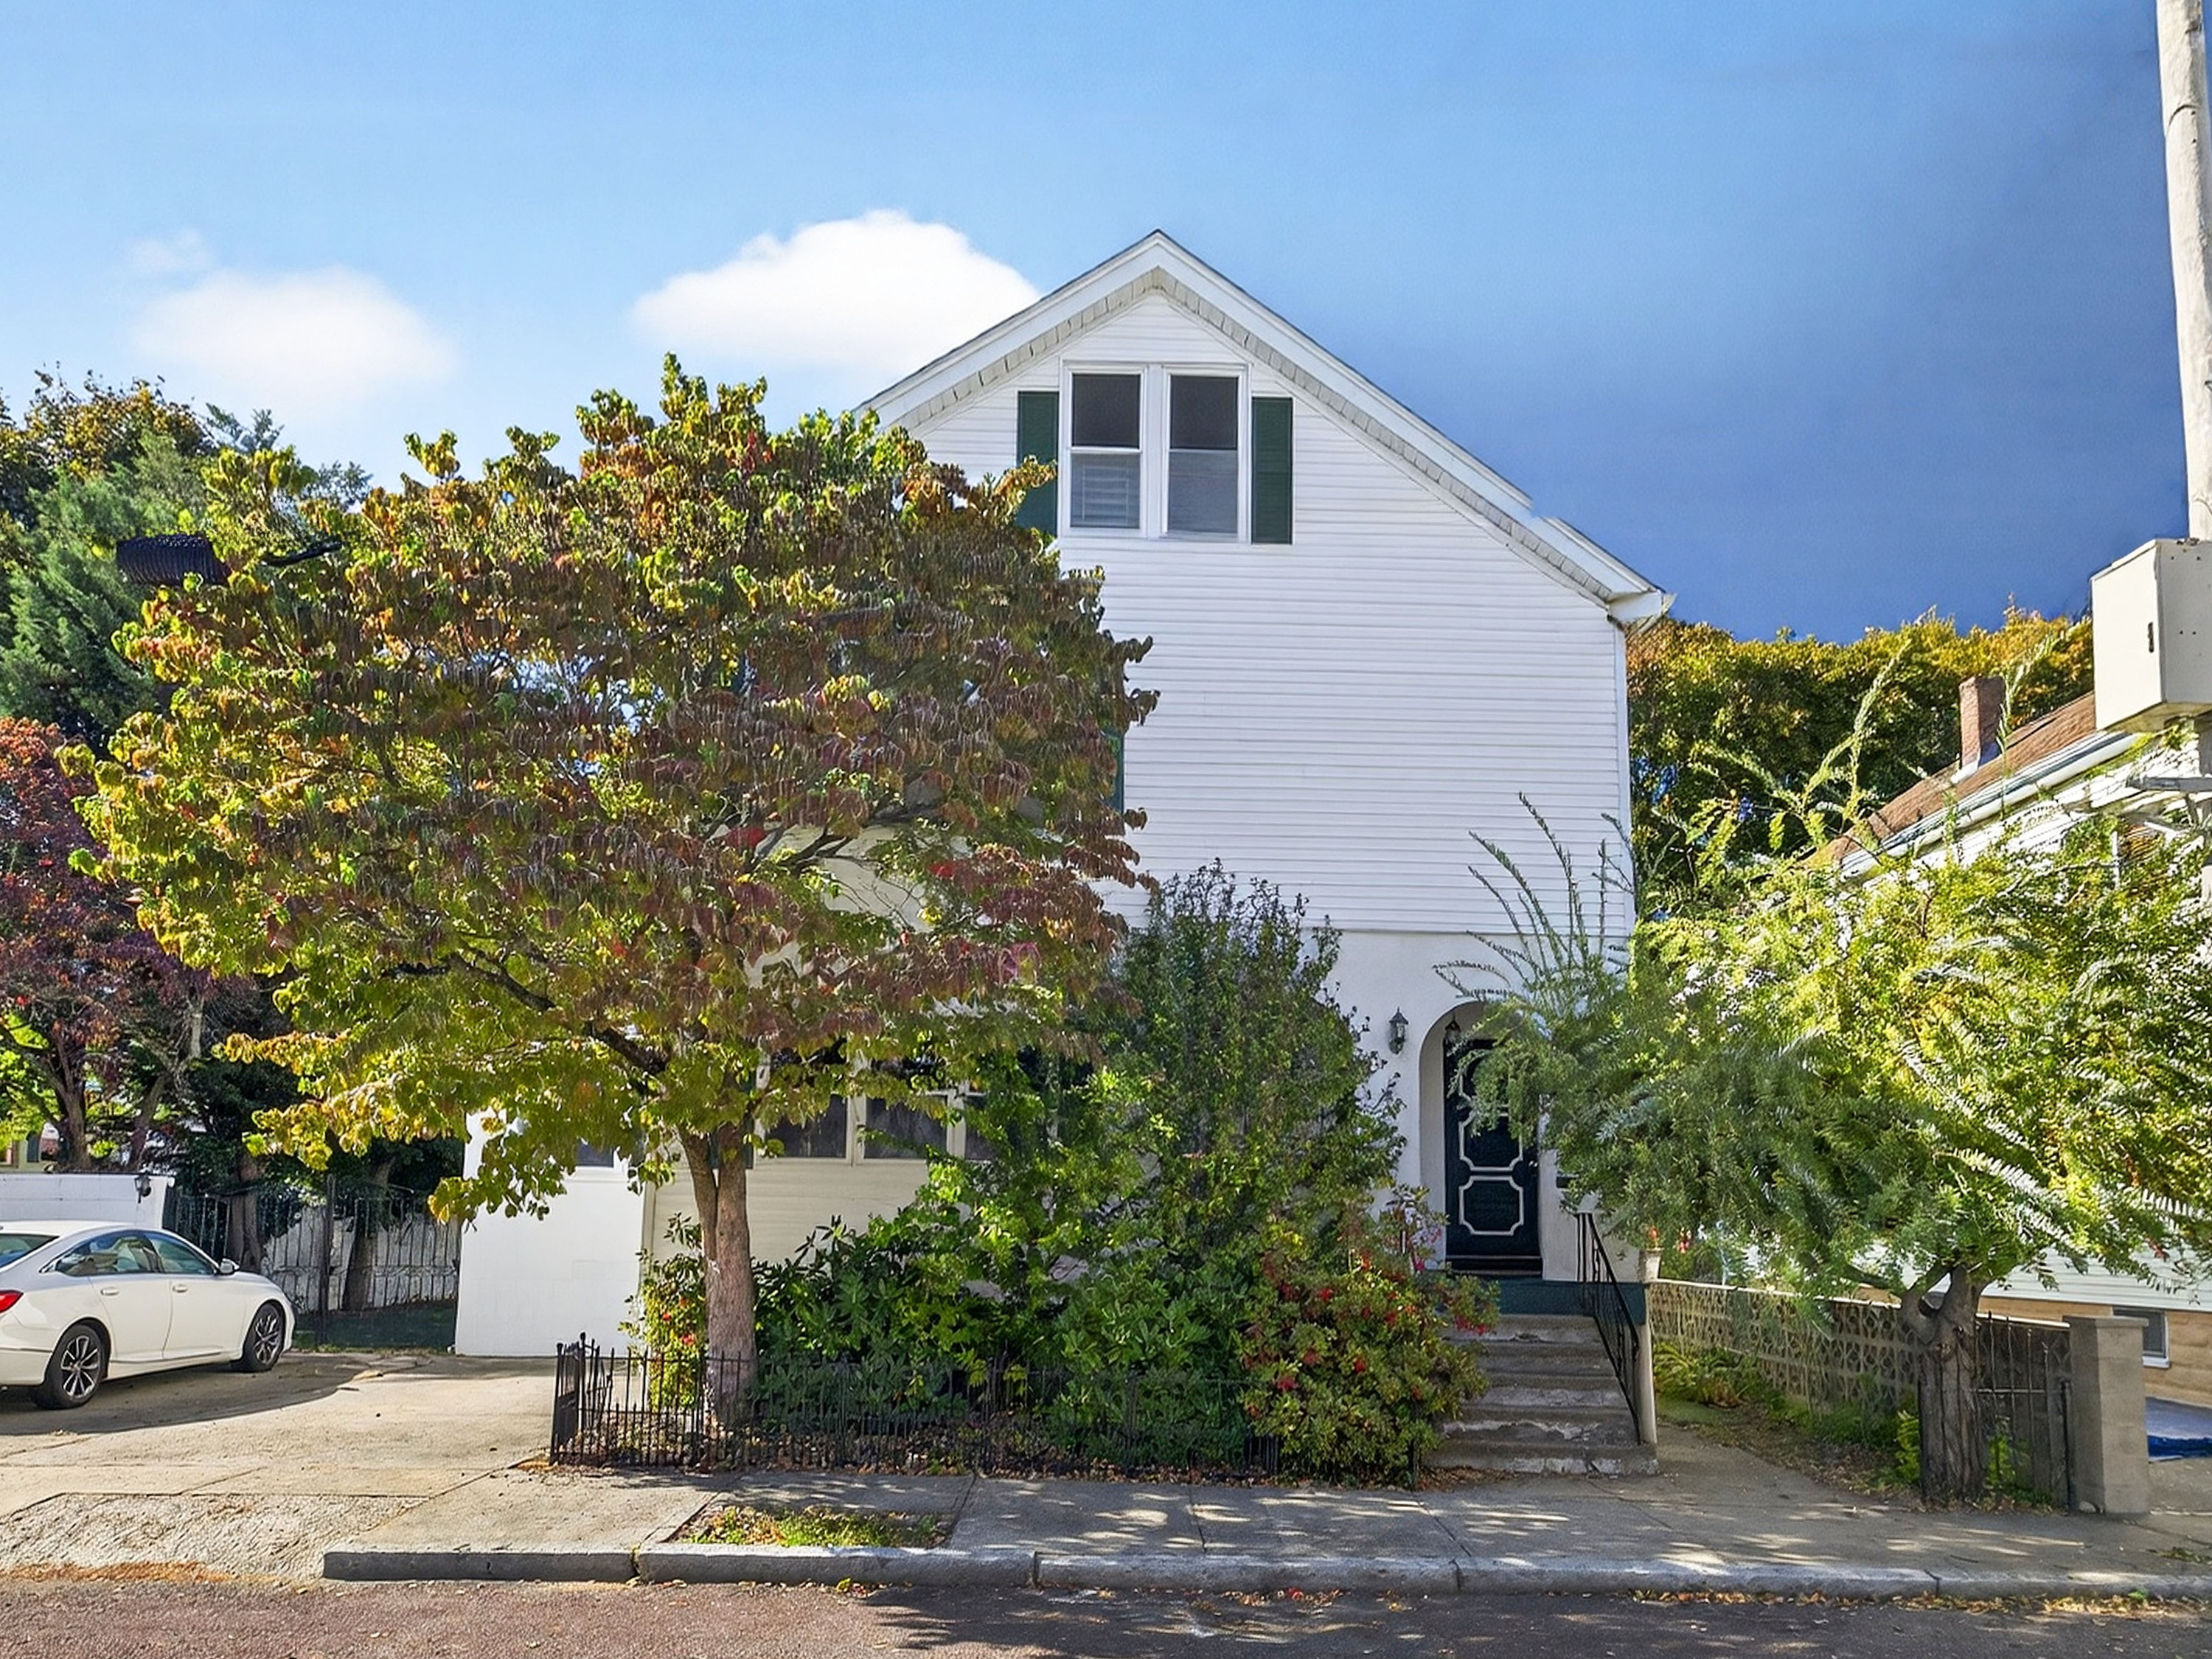
Inventory is the biggest story in Medford this fall. There are many more homes for sale than there were a year ago (+59%), and buyers are using that extra choice to take their time.
At the same time, Medford's closed sales fell through October (-7.0% across all three property types). Prices are roughly flat, homes are selling close to asking, and timelines are longer, especially for condos. That adds up to a balanced market.
Since 2014, the Santana Team has had more than 1,700 closings across Greater Boston. Here is what the MLS PIN numbers show for Medford through the end of October.
What does the Medford real estate market look like right now?
Year-to-date closed sales through October 31, 2026. Percentages in parentheses show the change from the same January to October window of 2025. Source: MLS PIN. Active listings from MLS PIN On-Market Snapshots as of November 10, 2026, compared with November 7, 2025 (contingent listings excluded). Days on market for active listings are from a November 7, 2026 snapshot.
| Metric | Single Family | Condo | Multi-Family |
|---|---|---|---|
| Avg. Sale Price | $971,058 (-0.3%) | $721,037 (+1.6%) | $1,130,126 (-1.9%) |
| Median Sale Price | $888,500 (-2.4%) | $685,000 (+5.2%) | $1,067,500 (-5.1%) |
| Avg. Days on Market | 32 days (+19%) | 59 days (+79%) | 36 days (+33%) |
| Sale Price as % of List | 102% (-2 pts) | 100% (-1 pt) | 100% (-3 pts) |
| Closed Sales YTD | 168 (-16.0%) | 161 (+7.3%) | 54 (-12.9%) |
| Active Listings (Nov 10, 2026) | 45 (+73.1%) | 59 (+22.9%) | 34 (+161.5%) |
| Avg. Days on Market, Active Listings (Nov 7) | 61 days | 76 days | 63 days |
A quick note on reading this: these are year-to-date figures through October, so they are not directly comparable to the year-to-date through March numbers in our April 2026 Medford update. The price rows compare the homes that sold in each year, not the change in value of the same homes, so a shift in which homes sold can move them as much as the market itself. That is why we show both the average and the median.
Why is inventory the biggest story in Medford this fall?
As of November 10, 2026, MLS PIN showed 138 active listings in Medford (+59%). Multi-families had the biggest increase, to 34 (+162%), followed by single-family homes at 45 (+73%) and condos at 59 (+23%).
Sales have moved the other way. Medford closed sales through October fell 7.0% across all three property types: single-family sales were down 16.0% and multi-family sales down 12.9%, while condo sales rose 7.3%. More supply and fewer sales is why buyers have more leverage than they did last year.
Current listings are sitting longer than the homes that sold. In early November, single-family homes, condos, and multi-families on the market had been listed for an average of 61, 76, and 63 days. Homes that sold this year took 32 to 59 days on average.
For buyers, that means more selection than last year and more time to decide. For sellers, it means more competition and a longer runway, so pricing accurately from the start matters.
Inventory at a Glance: Active listings: 138 (+59%) · Avg. days on market, active listings: 61 to 76 days · Closed sales YTD: 383 (-7.0%)
Are Medford single-family home prices holding steady?
Essentially, yes. The average single-family sale through October was $971,058 (-0.3%), and the median was $888,500 (-2.4%). Fewer homes sold (168, -16.0%).
Homes sold at 102% of list on average (-2 pts) and took 32 days on market (+19%). So buyers are still paying a bit over asking for the right home, but with less urgency than in 2025. That can vary a lot by area, from West Medford to the streets around Medford Square, and by condition. There are 45 single-family homes on the market as of November 10 (+73%), and single-family listings in early November had been on the market for an average of 61 days.
Single-Family at a Glance: $971K avg price (-0.3%) · 102% of list (-2 pts) · 32 days on market (+19%) · Active listings: 45 (+73%)
Are Medford condos taking longer to sell?
Yes, noticeably. Condos averaged 59 days on market through October (+79%). That is the biggest timeline change of any property type in Medford this year.
At the same time, more condos sold (161, +7.3%), the average sale price was $721,037 (+1.6%), and the median was $685,000 (+5.2%). Condos sold right at list on average (100%, -1 pt). So condos are still selling at solid prices, but buyers are taking longer to commit. There are 59 condos on the market as of November 10 (+23%), and condo listings in early November averaged 76 days on market.
For buyers, that means time to compare and ask good questions about the building and association. For sellers, it means planning for a longer runway and pricing carefully from the start.
Condo Market at a Glance: $721K avg price (+1.6%) · 100% of list (-1 pt) · 59 days on market (+79%) · Active listings: 59 (+23%)
What is happening with Medford multi-family homes?
Multi-families eased a bit this year. There were 54 closed sales through October (-12.9%). The average sale price was $1,130,126 (-1.9%), and the median was $1,067,500 (-5.1%).
They sold at 100% of list on average (-3 pts) and took 36 days on market (+33%). For investors and owner-occupants, that points to a market with less competition than last year and more room to evaluate the numbers on a property. There are 34 multi-families on the market as of November 10 (+162%), and multi-family listings in early November averaged 63 days on market.
Multi-Family at a Glance: $1.13M avg price (-1.9%) · 100% of list (-3 pts) · 36 days on market (+33%) · Active listings: 34 (+162%)
How did October 2026 look in Medford?
October sales were fairly light, so we would keep the takeaways modest. Single-family homes had 18 closed sales, averaging $869,944 at 100% of list with 33 days on market. Condos had 12 sales, averaging $657,792 at 99% of list with 73 days on market. Multi-families had 9 sales, averaging $1,013,333 at 96% of list with 53 days on market.
Those numbers are consistent with a more selective fall market, but with samples this small, a few sales can shift the averages quite a bit.
What does this mean for buyers and sellers in Medford?
Medford has more homes for sale than a year ago and fewer sales, and that drives most of what you see in the numbers. Prices are roughly flat, homes are selling near asking, and timelines are longer than last year.
For buyers, that means more selection than last year and more time to make decisions, especially with condos. For sellers, it means the market rewards homes that are priced accurately and well prepared, and it is worth planning for a few more weeks on market than you might have expected in 2025.
Common questions about the Medford real estate market
Are Medford home prices going down?
Not meaningfully. Through October, single-family averages were essentially flat (-0.3%), condos were up 1.6%, and multi-families were down 1.9%. Medians moved a bit more: single-family -2.4%, condos +5.2%, and multi-families -5.1%. These compare the homes that sold, not the value of the same homes.
How long does it take to sell a condo in Medford?
Condos averaged 59 days on market through October 2026 (+79%). Condos on the market in early November had been listed for an average of 76 days. Individual results vary a lot by building, price, and condition.
Are there more homes for sale in Medford right now?
Yes. As of November 10, 2026, there were 138 active listings in Medford (+59%): 59 condos (+23%), 45 single-family homes (+73%), and 34 multi-families (+162%).
Thinking about buying or selling in Medford?
Medford's neighborhoods can behave quite differently from one another. If you are living in Medford and thinking about a sale, or moving to Medford and starting a search, I am happy to walk through how these numbers apply to a specific property.
You can connect with the Santana Team.
Data is based on MLS PIN year-to-date closed sales from January 1 through October 31, 2026, compared with the same period in 2025, plus October 2026 closed sales and MLS PIN On-Market Snapshots as of November 10, 2026 (compared with November 7, 2025) and November 7, 2026. Percentage changes compare 2026 with the same period of 2025. Market conditions can change, and individual property outcomes may vary.

Santana Team
| Santana Team | Keller Williams Boston Northwest
or another way